
The purpose of this web app is to provide a visualization of up-to-date pest sampling data from the yellow sticky trap network deployed throughout the Imperial Valley. The app is best viewed on a large screen (e.g., laptop or desktop). The desktop version of this web app is optimized for viewing on larger-screen devices. The mobile version of this application is optimized for mobile phones and small screens.
How to use this tool
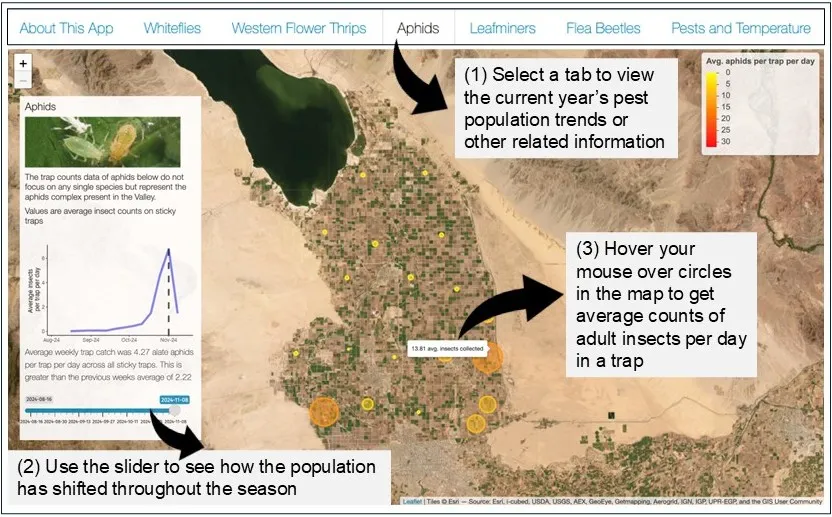
This app was designed to visualize up-to-date pest sampling data from the yellow sticky trap network deployed throughout the Imperial Valley. Figure 1 is a screenshot of a web app describing its features and how to access them. The features include: (1) You can select a pest by clicking a tab at the top of the page to view the current year's population trends. (2) You can use the slider to see how populations have shifted throughout the season. (3) You can hover your mouse over circles in the map to get average counts of adult insects in each trap location corresponding to the sampling week selected using the slider tool. The trap locations shown on the map may not represent the exact physical locations of traps due to privacy concerns, but they are within a 2-mile radius of actual trap locations.
About Imperial Valley Areawide Pest Monitoring Program:
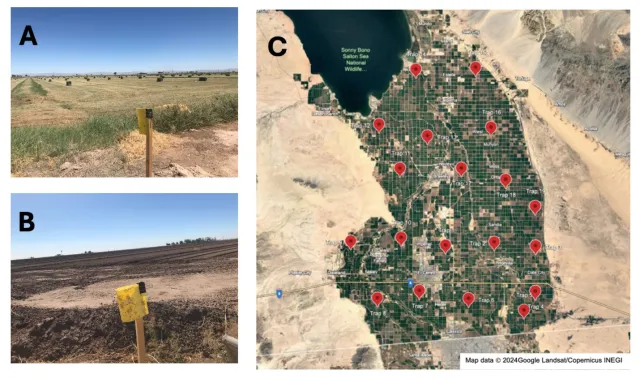
Since the first week of August 2024, the UCCE Entomology program at Imperial County has maintained a yellow sticky trap network across the Imperial Valley. This trap network aimed to facilitate landscape-level monitoring of the population dynamics of adult whiteflies, western flower thrips, flea beetles, Bermudagrass stem maggot adults, and aphids throughout the year. The trap set up in the field consists of a 6 × 12 in (15.2 × 30.5 cm) yellow sticky trap (Olson Products, Medina, OH), shaped into a cylinder, attached to a wooden stake using a binder clip, and positioned about 60 cm above the ground (Fig. 2A and 2B). In this project, 19 traps are distributed throughout the Imperial Valley, covering major agricultural locations (Fig. 2C). Insects attracted to the yellow color of the traps and those that land on the trap during flight get trapped on its sticky surface. The traps are replaced weekly and are examined in the laboratory under a stereo microscope to count the pest population.
Insect count data from these traps identify the adult insect activity of targeted pests around the fields. Since several biological and physical factors and farm operations (insecticide sprays, dust from the land preparation, crop harvest, etc.) can influence insect counts in the traps, the insect numbers in sticky traps do not always strongly correlate with the actual infestation levels in the grower’s field. Despite this, the trap counts are a valuable indication of adult insects’ movement across the landscape. Moreover, collecting the trap data across multiple years will help establish a baseline of pest activity across the season. This historical pest data can then be compared with current pest activity in the traps to identify population trends.
This project is supported by the Imperial County Agricultural Benefits Program grant (2024-2027).
This tool was created by:
Benjamin Lee at the California Department of Food and Agriculture with Arun Babu at UC Cooperative Extension-Imperial County. Benjamin can be reached at bwalee@ucdavis.edu. If you are interested in additional data from this project or have questions or comments, contact Arun Babu at arbabu@ucanr.edu.