
Research Brief • August 2024 • Download PDF (224 KB)
Background
In March 2023, an online survey gathered insights from Texas foodservice directors (FSDs) about their experiences implementing school meals during the 2022-23 school year (SY) after the federal waivers allowing school meals to be served free of charge to all students ended. A total of 367 FSDs and other foodservice personnel responded to the survey, representing 31% of Texas school districts.
Characteristic | % of Sample |
Foodservice Directors | 88% |
Other School Nutrition Personnel | 12% |
Urban or Suburban | 28% |
Small Enrollment Size (<2,500 students) | 69% |
No CEP or Provisions 1 or 2 | 47% |
40% or more students eligible for Free or Reduced-Price Meals | 79% |
Key Findings
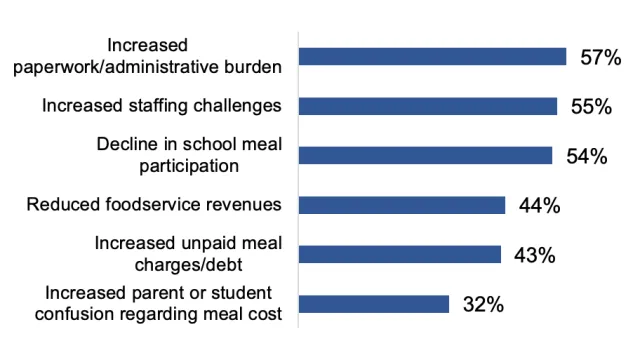
The end of the federal waivers allowing meals to be served free of charge to all students was associated with negative impacts on meal participation, finances, and operations
Approximately half of FSDs reported reduced meal participation (54%) and food service revenues (44%). Many also reported a rise in unpaid meal charges (43%) and administrative burden (57%). Staffing challenges were also reported, with 55% facing increased difficulties (Figure 1).
Income verification posed challenges, with fewer families returning meal applications
Direct certification was the primary method for determining eligibility for free or reduced-price meals, used by 98% of FSDs. Among the FSDs that reported using traditional meal applications (66%), the mean return rates were estimated at only half (48%). Those using alternative income forms (26%) reported even lower return rates at 33%. Most districts (73%) reported offering online application options to streamline the process and 25% reported lower return rates compared to pre-pandemic levels.
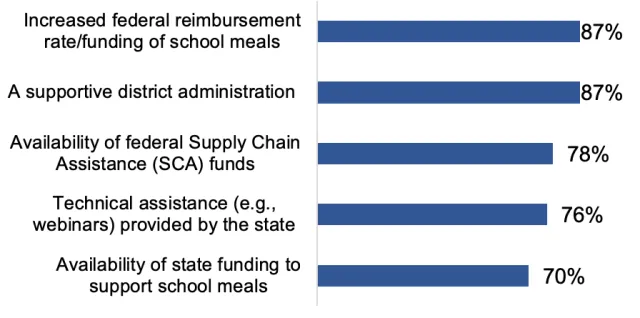
Multiple factors helped support Texas FSDs during the SY 2022-23
The top factors that helped support SFAs include increased federal reimbursement rates (87%), support from district administration (87%), and federal Supply Chain Assistance Funds (78%), state technical assistance (76%) and state funding (70%) (Figure 2).
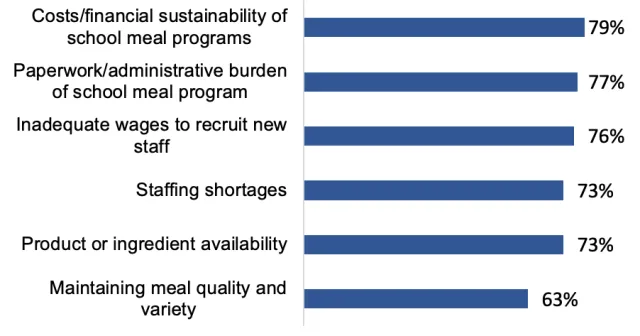
FSDs faced many challenges in implementing school meal programs in the SY 2022-23
Operational challenges also existed, with 79% facing financial sustainability issues, 77% burdened by administrative tasks, and 73% struggling with product availability. Staffing shortages (73%) and inadequate wages (76%) further complicated operations (Figure 3).
FSDs reported some challenges with cafeteria operations
Over a third of SFAs reported challenges with inadequate refrigeration or freezer space (39%) and inadequate time-to-eat for students (35%) (Figure 4). Other challenges in the cafeteria included long lines for students to get the food (29%) and inadequate kitchen preparation space (26%) and dining space (26%).

FSDs reported concerns about the financial sustainability of school meal programs.
Only about a third of respondents reported that current reimbursements covered the full cost of producing breakfast (34%) and lunch (37%). Suggested reimbursement rates to meet federal standards were $3.86 for breakfast and $5.27 for lunch. To consistently include fresh, local produce, the suggested rates were higher: $3.98 for breakfast and $5.40 for lunch.
The maximum federal reimbursements at the time were $2.67 and $4.58 for free breakfast and free lunch, respectively.
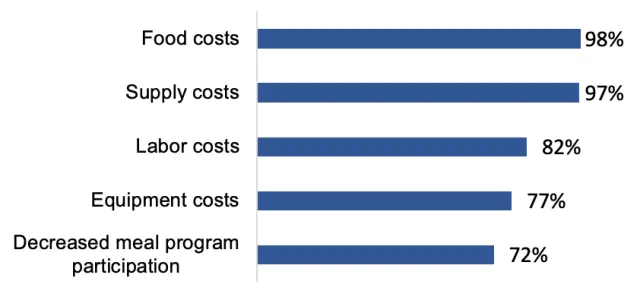
FSDs who reported that the current reimbursement wasn’t enough to cover the costs of producing the meals identified the factors impacting their financial deficit
Almost all SFAs reported that the costs of food (98%) and supplies (97%) impacted their revenues (Figure 5). Most SFAs also reported labor (82%) and equipment (77%) costs, as well as decreased student participation in meal programs (72%), as factors impacting their revenues.
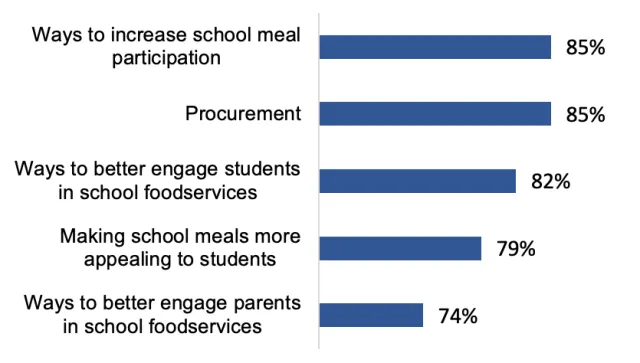
FSDs identified additional technical assistance and training that could benefit their SFA
Most SFAs reported needing help to increase student participation in meal programs (85%), procurement (85%), and finding ways to better engage students in school foodservices (82%) (Figure 6). Other ways in which SFAs can be assisted include making meals more appealing to students (79%) and engaging parents in school foodservices (74%).
Texas FSDs reported perceived barriers to student participation in school meals.
Top barriers include students preferring meals from home (65%), finding portions insufficient (59%), and preferring to eat á la carte options (53%). Half of FSDs reported students disliking the meal’s taste and getting tired of the options as additional barriers to student participation.
Conclusion
The 2022-23 FSD survey highlighted significant impacts and challenges faced by Texas schools in the post-pandemic era. The transition away from federal waivers allowing school meals to be served free of charge to all students negatively affected meal participation, school foodservice financial stability, and operational procedures. Effective communication and support from federal and state programs have helped maintain effective school meal programs. The findings emphasize the need for continued financial support and operational adjustments to ensure the success of school meal programs in Texas.
Acknowledgements: The Nutrition Policy Institute, University of California Division of Agriculture and Natural Resources, is funded to conduct an evaluation of California’s Universal School Meals through CA SB 170 (2021), CA SB 154 (2022), and CA SB 101 (2023). We thank the school nutrition personnel who took the time to respond to the survey. For more information, visit NPI's School Meals for All website.
Suggested Citation: Zuercher M, Esparza E, Ritchie L, Gosliner W. Research Brief: Texas Food Service Director Survey Findings: Experiences transitioning from meals free of charge for all students. Nutrition Policy Institute, University of California, Agriculture and Natural Resources. 28 August 2024.
University of California Agriculture and Natural Resources is an equal opportunity employer.
© 2024 UC Regents, Creative Commons 4.0 International License.
