UC ANR is committed to providing an accessible and inclusive web experience for all users. If you encounter an accessibility barrier or need content in an alternative or remediated accessible format, please contact anraccessibility@ucanr.edu.
SFREC News
Article
Rangeland Forage Production & Sensor Data - March 2019
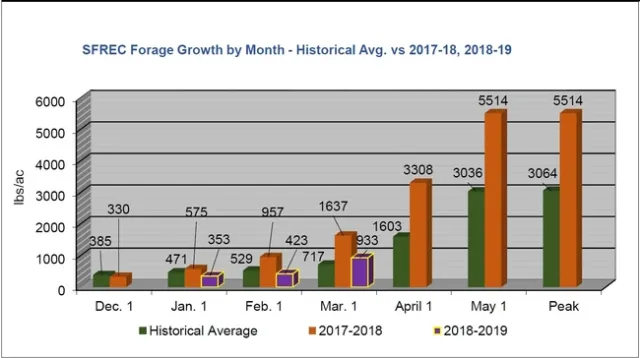
Bar chart titled 'SFREC Forage Growth by Month - Historical Avg. vs 2017-18, 2018-19.' It shows forage growth in pounds per acre for December through peak, with three color-coded bars: green for historical average, orange for 2017-2018, and yellow for 2018-2019. The chart indicates that forage growth peaked in May and the peak values are 5514 lbs/acre for both 2017-18 and 2018-19.
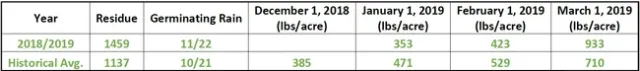
Table comparing residue, germinating rain, and weights in pounds per acre for the years 2018/2019 and the historical average, from December 2018 to March 2019. It shows residue values of 1459 and 1137, germinating rain dates of 11/22 and 10/21, and weights ranging from 353 to 933 lbs/acre.
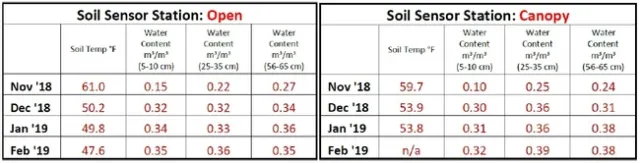
Tables showing soil sensor station data for open and canopy locations from November 2018 to February 2019. Each table includes soil temperature in Fahrenheit and water content in m³/m² at depths of 5-10 cm, 25-35 cm, and 65-65 cm, with some entries marked as n/a.
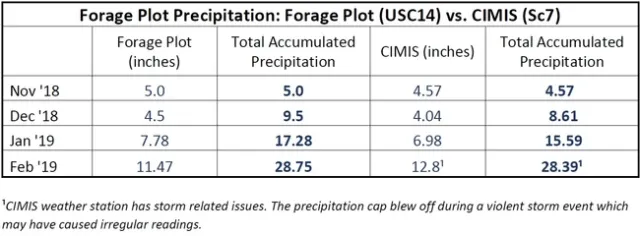
Table comparing forage plot precipitation data for November 2018 to February 2019, including measurements of forage plot size in inches, total accumulated precipitation in inches, CIMIS station data, and notes about equipment failure. The table shows increasing precipitation over time, with the highest totals in February.