UC ANR is committed to providing an accessible and inclusive web experience for all users. If you encounter an accessibility barrier or need content in an alternative or remediated accessible format, please contact anraccessibility@ucanr.edu.
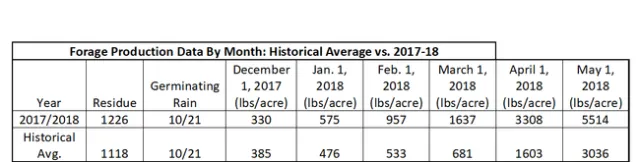
Table titled "Forage Production Data By Month: Historical Average vs. 2017-18." It shows data for the year 2017/2018 and the historical average, including residue, germinating rain, and pounds per acre for December 1, January 1, February 1, March 1, April 1, and May 1, with peak values at 5514 lbs/acre.
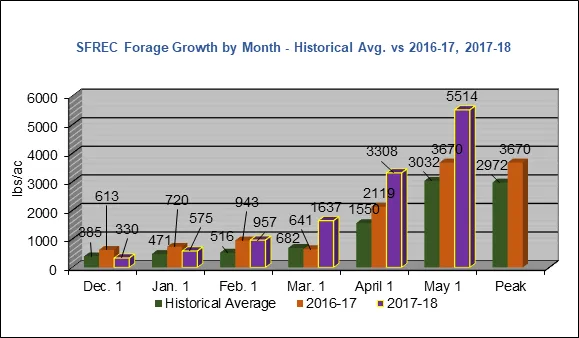
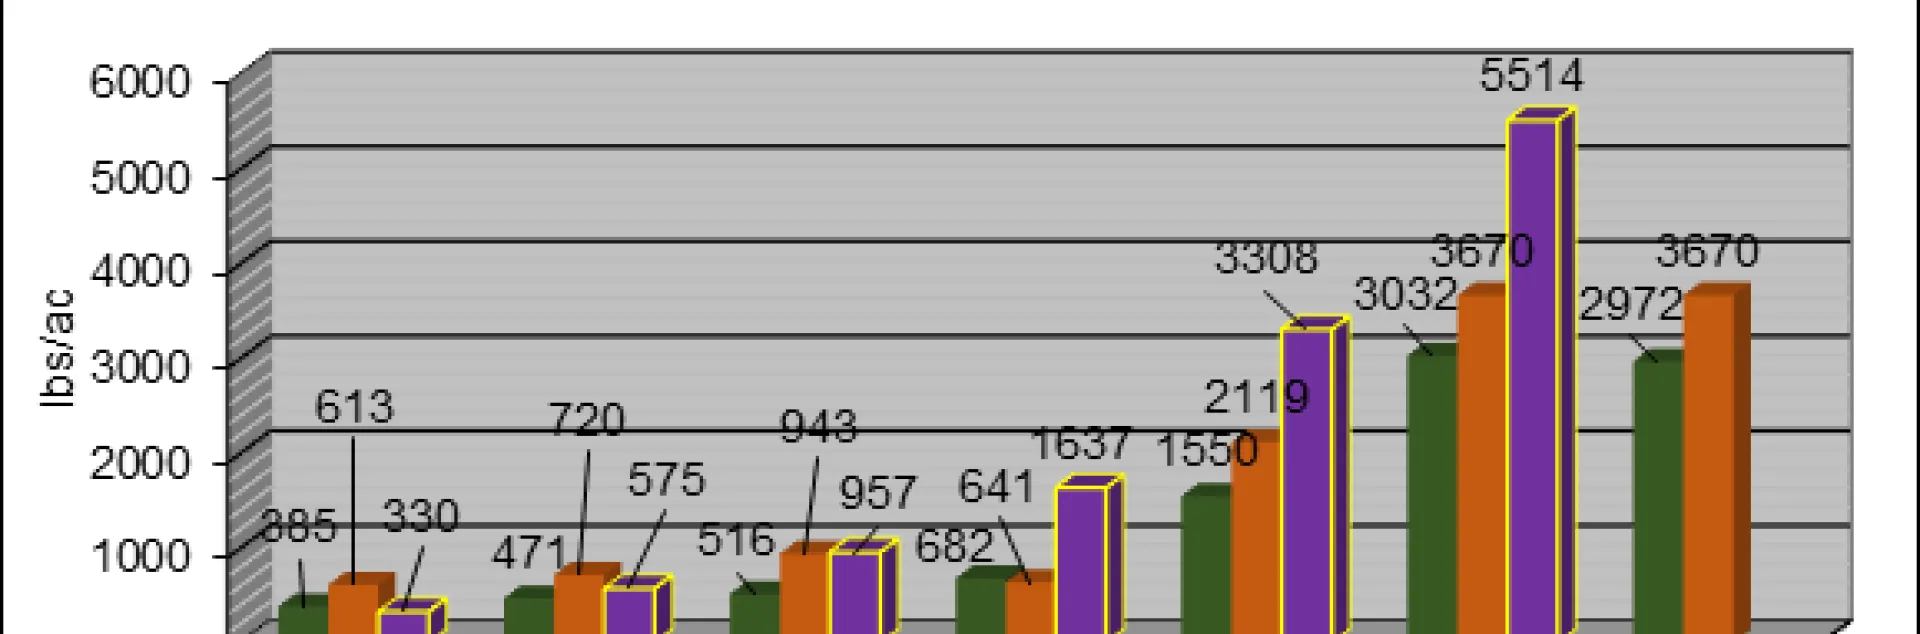
Bar chart titled "SFREC Forage Growth by Month - Historical Avg. vs 2016-17, 2017-18." The chart displays forage growth in pounds per acre for December through peak, with three color-coded bars: green for historical average, orange for 2016-17, and purple for 2017-18. The highest peaks are in May, reaching 5514 lbs/acre for 2017-18.