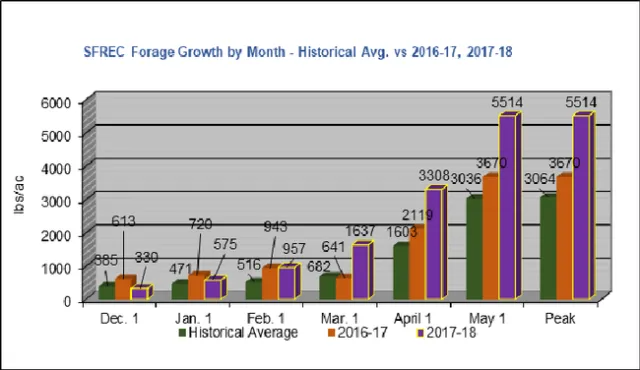
A line and bar chart titled "SFREC Forage Growth by Month - Historical Avg. vs 2016-17, 2017-18" showing forage growth in pounds per acre from December to peak, with bars for historical averages (green), 2016-17 (orange), and 2017-18 (purple). Peak forage growth in May reaches 5514 lbs/acre for both 2017-18 and 2016-17.
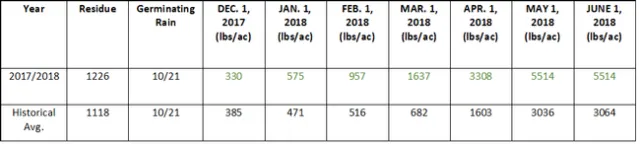
A table comparing residue, germinating rain, and weights in pounds per acre across different dates for 2017/2018 and the historical average, showing residue values of 1226 and 1118, germinating rain of 10/21, and weights from 3308 to 5514 lbs/acre.
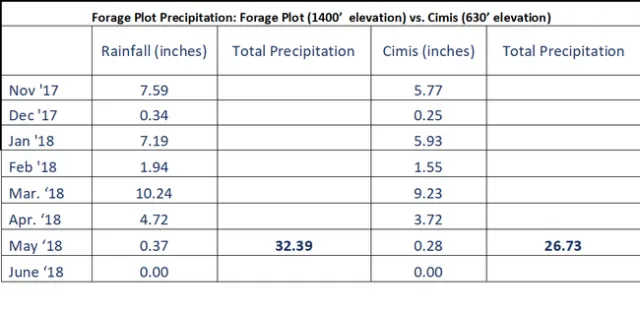
A table showing forage plot precipitation data from November 2017 to June 2018, including rainfall in inches, total precipitation, CIMIS station data, and totals, with increasing rainfall totals over time and notes on equipment failure in April 2018.
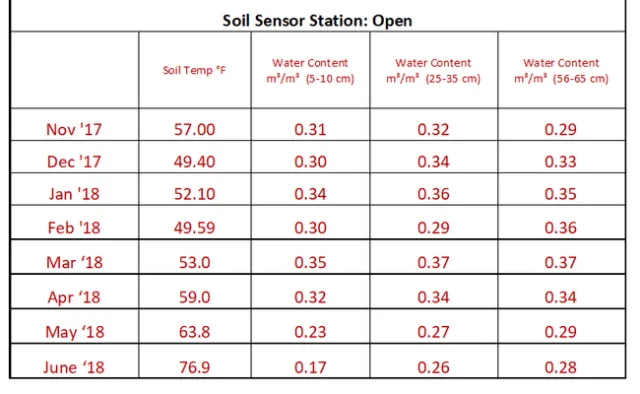
A table with soil sensor station data for open location from November 2017 to June 2018, including soil temperature in °F and water content in m³/m² at depths of 5-10 cm, 25-35 cm, and 56-65 cm. Soil temperature ranges from 49.40°F to 76.9°F, and water content varies across months.
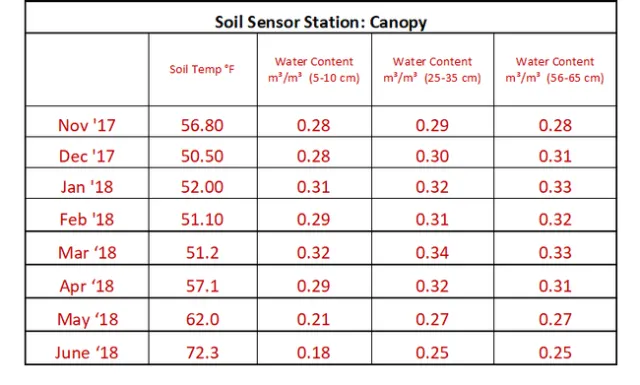
A table with soil sensor station data for canopy location from November 2017 to June 2018, showing soil temperature in °F and water content in m³/m² at the same depths. Temperatures range from 50.50°F to 72.3°F, with water content generally decreasing over time.